First Advance Estimates of National Income, 2021-22 20/01/2022 – Posted in: Daily News – Tags: First Advance Estimates of National Income, First Advance Estimates of National Income 2021-2022, National Income
First Advance Estimates of National Income, 2021-22
In News
The First Advance Estimates (FAE) of National Income at both Constant (2011-12) and Current Prices, for the financial year 2021-22 has been released by the National Statistical Office.
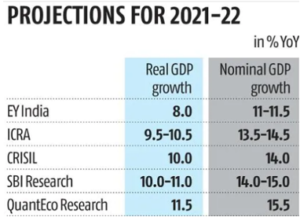
- Earlier, RBI in his professional forecasters survey, pegged the median value of GDP growth for this fiscal at 9.5%.
First Advance estimates
- The Indian economy is expected to expand at 9.2 per cent in 2021-22.
- There is a sharp increase in nominal GDP (estimated to expand by 17.6% this fiscal).
- Double-digit wholesale price inflation (WPI) and the persistence of high consumer price inflation (CPI) have led to the surge in nominal GDP and added an upside to tax collections this year.
Three reasons these advance estimates could change:
- These estimates are based on the limited information which typically undergo a change when new information is available.
- The emergence of the omicron variant in this last quarter of the current fiscal year.
- Pointed by the National Statistical Office, “the First Revised Estimates for 2020-21, due for release on 31.01.2022, may also lead to a revision in growth rates reflected in FAE.”
First Advance Estimates· The First Advance Estimates of GDP was introduced in 2016-17. · It serves as essential inputs to the Budget exercise. · It is based on limited data and compiled using the Benchmark-Indicator method i.e. the estimates available for the previous year (2020-21 in this case) are extrapolated using relevant indicators reflecting the performance of sectors. |
How estimates have been calculated?
The sector-wise estimates have been compiled using indicators like:
- Index of Industrial Production (IIP) of first 7 months of the financial year
- Financial performance of Listed Companies in the Private Corporate sector available upto quarter ending September, 2021
- 1st Advance Estimates of Crop production
- Accounts of Central & State Governments
- Bank Deposits & Credits
- Net Tonne Kilometres and Passenger Kilometres for Railways
- Passengers and Cargo handled by Civil Aviation
- Cargo handled at Major Sea Ports
- Sales of Commercial Vehicles, etc., available for first 8 months of the financial year.
| · Projections for 2021-22 for passengers and cargo handled, were also made use of in compilation of estimates of respective sectors.
· Percentage change in the main indicators used in the estimation are given in the Annexure. |
- The total tax revenue used for GDP compilation includes non-GST revenue and GST revenue.
- The Budget Estimates of tax revenue for 2021-22, available on CGA and CAG websites have been used for estimating taxes on products at current prices.
- For compiling taxes on products at constant prices, volume extrapolation is done using volume growth of taxed goods and services.
- The total product subsidies were compiled using the latest information on major subsidies viz. Food, Urea, Petroleum.
What does the GDP data tell us about the state of the economy that could influence budget priorities?
- The share of private consumption in GDP has been falling since the pandemic struck. The level of private consumption is still 2.9 per cent below its pre-pandemic year.
- The ratio of private consumption to GDP fell to 54.7 per cent in 2021-22 from 55.6 per cent in 2019-20.
- GDP in construction is barely above its pre-pandemic level, while trade, hotels, tourism and other contact-based services, which are also labour-intensive, lag the pre-pandemic levels.
- Similarly, a pick-up in demand for MGNREGA jobs means a lack of rural employment opportunities.
- Rural wages for agriculture and non-agriculture have been flat in real terms.
- Weak tractor and motorcycle demand mirror the weakness in the rural economy.
- GDP data shows that investments are doing better than private consumption with their share in GDP crossing the 2019-20 levels, due to government investments.
Available solution
- The budget will need to extend support to rural areas till the situation normalises.
- A revival of consumption demand is also needed for a broad-based revival of investments.
- Union Budget need to continue pressing the pedal hard on infrastructure-focused capital expenditure.
National Income· National income means the value of goods and services produced by a country during a financial year. · It is the net result of all economic activities of any country during a period of one year and is valued in terms of money. |
National Family Health Survey-5
In News
The National Family Health Survey (NFHS-5, 2019-21) has shown that fertility continues to decline in India.
- The Total Fertility Rate (TFR) has declined from 2.2 (NFHS-4, 2015-16) to 2.0, below the replacement rate of 2.1, where a mother is replaced by a daughter.
- The TFR is the number of children a woman can be expected to have during her lifetime.
Background
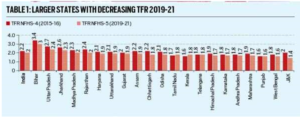
- From an estimated TFR of around 6 in 1951, the rate declined to 5.2 in 1971, 3.6 in 1991 and 2.4 in 2011.
- Since 2000, the pace of decline in TFR may have slowed. As the TFR in most states declined during the period 2015-16 and 2019-21, we can expect it to continue to decline for some time.
Key Findings
- Kerala and Tamil Nadu show the TFR rising from 1.6 and 1.7 respectively to 1.8 during this period.
- Only a few large states have a TFR below 1.7 — Punjab, West Bengal and the UT of Jammu and Kashmir.
- The two states with the highest fertility rate — Bihar (TFR 3.0) and Uttar Pradesh (TFR 2.4).
- The contraceptive prevalence rate (CPR) by all methods (modern and other methods such as rhythm) is higher in UP (62.4 per cent) compared to Bihar (55.8 per cent), although both are lower than India (66.7 per cent).
- The percentage of adult literate women is 57.8 in Bihar and 66.1 in UP, compared to 71.5 in India.
- Women’s status indicators are generally somewhat better in UP compared to Bihar but lower than in India as a whole.
- Women with 10 or more years of schooling are 28.8 per cent in Bihar and 39.3 per cent in UP compared to 41.0 per cent in India.
- Use of modern contraceptive methods increased from 47.8 per cent in NFHS-4 to 56.5 per cent in NFHS-5, which largely contributed to fertility decline.
- Female sterilisation has been the single most dominant method of contraception, accounting for 67 per cent of the total in NFHS-5.
Some other findings
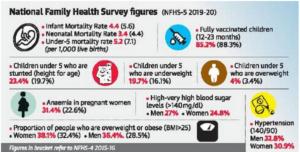
- The proportion of stunted children below the age of 5 has marginally declined from 38.4 percent to 35.4 percent.
- Inadequate diet among children less than 23 months of age is perhaps a major cause. Both breastfeeding and non-breastfeeding children 6-23 months of age receiving an adequate diet are estimated to be only 12.7 per cent and 11.3 per cent respectively.
- The NFHS-5 results also highlight two major public health concerns – obesity and tobacco use- both known to be risks for non-communicable diseases.
- Nearly a fourth of all women and men and men are overweight or obese (BMI = 25.0 kg/m2) and this proportion is increasing over the years.
- More than a third of men (38 per cent) were reported to be using some kind of tobacco.
Future predictions
- The medium-fertility variant of the UN Population Division’s estimate of population peaking at 165 crore around 2050 will be realised.
- According to SRS, the birth rate is higher and the death rate is lower than its model estimates.
- However, the TFR estimates in NFHS-5 are lower than that predicted by the model, which may provide some balancing effect.
- The estimates for sex ratio at birth (SRB), the number of girls per 1,000 boys, vary.
Conclusion
- The NFHS-5 results indicate that progress has been made in almost all areas.
- Bihar and Uttar Pradesh need to strengthen their family planning and maternal and child health programmes as well as improve women’s status to bring TFR to replacement level or below.
- The pace of improvement in improving sex ratio at birth needs to be maintained.
- Child nutrition programmes may require a rethink and more active involvement of the community is needed to address this serious problem.
- Attention is required to reduce public health risks arising from increasing obesity and high tobacco use.
Chang’e 5 lunar lander
In News
China’s Chang’e 5 lunar lander has found the first-ever on-site evidence of water on the surface of the moon.
- It is revealed that the lunar soil at the landing site contains less than 120 parts-per-million (ppm) water or 120 grams water per ton, and a light, vesicular rock carries 180 ppm, which are much drier than that on Earth.
What is the Chang’e-5 mission?
- Chang’e-5 probe, named after the Chinese Moon goddess, is the Chinese National Space Administration’s (CNSA) lunar sample return mission.
- The goal of the mission is to land in the Mons Rumker region of the moon, where it will operate for one lunar day, which is two weeks long and return a 2 kg sample of the lunar rock possibly by digging about 2 metres deep into the surface of the Moon.
- The Chang’e-5 spacecraft landed on one of the youngest mare basalts located at a mid-high latitude on the moon. It measured water on the spot and retrieved samples weighing 1,731 grams.
Components
- The mission comprises a lunar orbiter, a lander and an ascent probe that will lift the lunar samples back into orbit and return them back to Earth.
- Chang’e-5 comprises a robotic arm, a coring drill, a sample chamber and is also equipped with a camera, penetrating radar and a spectrometer.
How water content is estimated?
- The water content can be estimated since the water molecule or hydroxyl absorbs at a frequency of about three micrometers.
- It was the solar wind that contributed to the most humidity of lunar soil as it brought hydrogen that makes up the water.
- The additional 60 ppm water in the rock may originate from the lunar interior.
What else study tell us?
- The moon had turned drier within a certain period, owing probably to the degassing of its mantle reservoir.
- The returned samples are a mixture of granules both on the surface and beneath.
Chinese Lunar Exploration Program
The Chinese Lunar Exploration Program has four phases:
- Phase one: orbiting the Moon, completed by Chang’e 1 in 2007 and Chang’e 2 in 2010.
- Phase two: soft landing and deploying rover on the Moon, completed by Chang’e 3 (2013) and Chang’e 4 (launched in December 2018, landed on the far side of the Moon in January 2019).
- Phase three: returning lunar samples, completed by Chang’e 5. The backup of Chang’e-5, the Chang’e 6 mission, is also a lunar sample-return mission.
- Phase four: in-situ resource utilization, and constructing an International Lunar Research Station near the lunar south pole.